
In the last decade, Australian workplaces have witnessed over 1,850 traumatic injury fatalities, and more than 1,140,000 workers have filed serious compensation claims involving at least one week of lost work time. This equates to roughly one in every twelve workers.
While every worker has the right to a safe working environment, work-related injuries and illnesses can affect any industry or occupation, impacting not only workers but also their families and the broader community.
According to Safe Work Australia’s research, ‘Safer, Healthier, Wealthier,’ eliminating work-related injuries and illnesses could boost Australia’s economy by $28.6 billion annually, create 185,500 additional full-time equivalent jobs, and raise the average wage by 1.3% for workers across all skill levels.
The latest findings from the Key Work Health and Safety Statistics 2023 reveal that:
- Most work-related injuries in Australia stem from body stress, falls, slips, trips, and being hit by moving objects.
- Fatalities predominantly result from vehicle incidents and being struck by moving objects.
- Work-related mental health conditions are on the rise, with considerably longer time off work compared to other injuries.
Work-related Injury Fatalities
Safe Work Australia has compiled the Work-related Traumatic Injury Fatalities dataset, offering comprehensive national statistics on fatalities among both workers and bystanders during work-related incidents.
This dataset draws from various sources, including:
- Initial reports of fatalities in the media or on relevant authority websites, such as police, road authorities, and the Australian Transport Safety Bureau.
- Notifications to Safe Work Australia from jurisdictional authorities.
- The National Coronial Information System provides confidential access to reports from coroners, police, and other investigative agencies.
Please note that this dataset excludes work-related fatalities resulting from diseases, natural causes, and suicides. Additional explanatory notes regarding the data can be found on the “About our Datasets” page of the interactive data website.
This report focuses on individuals who suffered fatal injuries during the course of a work activity, commonly referred to as “worker fatalities,” within Australian territories or territorial seas.
In 2022, there were 195 worker fatalities attributed to traumatic injuries sustained during work-related activities. While the overall trend in the number and rate of fatalities has been decreasing since 2007, it has remained relatively stable in recent years.
Over the past five years (2018 to 2022), the average fatality rate stood at 1.4 fatalities per 100,000 workers, resulting in an annual average of 180 worker fatalities. Notably, there has been an increase in both the number and rate of fatalities compared to the previous year, with a 13% rise from 172 fatalities in 2021 and an 8% increase from 1.3 fatalities per 100,000 workers in 2021.
The lowest recorded fatality rate, at 1.1 fatalities per 100,000 workers, was documented in 2018.
Trends in Worker Fatalities, 2003 to 2022
Worker fatalities – Demographics, 2022
1) Worker Fatalities by Sex, 2022
The overwhelming majority of individuals who lose their lives due to work-related incidents are male, accounting for 93% of all fatalities in 2022. Additionally, males exhibit a higher fatality rate compared to females, with a rate of 2.5 fatalities per 100,000 workers.
2) Worker fatalities by age group, 2022
In the year 2022, individuals aged 45 and above represented a significant majority, constituting approximately 62% of all worker fatalities documented.
Among these age groups, workers aged 65 and over exhibited the highest fatality rate, standing at 6.2 fatalities per 100,000 workers. This rate was more than four times greater than the overall worker fatality rate of 1.4 fatalities per 100,000 workers.
Conversely, younger workers under the age of 25 years had the lowest fatality rate, amounting to 0.8 fatalities per 100,000 workers, closely followed by those aged 25 to 34, with a rate of 0.9 fatalities per 100,000 workers.
3) Worker fatalities by state/territory, 2022*
It’s important to note that the presentation of fatalities is based on the state or territory where the fatality occurred, not the jurisdiction under which it falls.
In 2022, New South Wales registered the highest number of fatalities, with 51 workers losing their lives, closely trailed by Queensland, which reported 49 worker fatalities.
When considering the fatality rate, Western Australia had the highest rate, recording 2.2 fatalities per 100,000 workers, followed by the Northern Territory with 2.1 fatalities per 100,000 workers.
Worker fatalities – Mechanism, 2022
Worker Fatalities by Most Common Incident Mechanisms in 2022
The term “mechanism of incident” encompasses the comprehensive action, exposure, or event that characterizes the circumstances leading to a worker fatality.
In the year 2022, vehicle incidents (involving 81 workers, accounting for 42%) and incidents where workers were struck by moving objects (involving 26 workers, representing 13%) collectively constituted more than half (55%) of all worker fatalities.
The category of vehicle incidents encompasses situations where occupants of vehicles are fatally injured, either through collisions with other vehicles or stationary objects. These vehicles encompass not only road vehicles such as cars and trucks but also machineries like aircraft, boats, loaders, tractors, and quad bikes.
Being hit by moving objects includes fatalities resulting from workers on foot being struck by vehicles, as well as incidents involving the impact of other moving equipment or objects.
Persistent Link Between Vehicles and Work-Related Fatalities Continues
In 2022, approximately 72% (141) of worker fatalities were directly linked to the involvement of at least one vehicle, indicating a slight increase from the 2021 figure of 68% (117).
Among these fatalities, about 41% (58) were associated with the presence of at least one truck in 2022. This marks a decrease from the 2021 figure of 53% (62) of such fatalities involving trucks.
Interestingly, single-vehicle incidents led to a significantly higher number of worker fatalities compared to incidents involving multiple vehicles. Specifically, 77% (108) of vehicle-related worker fatalities in 2022 resulted from single-vehicle incidents.
Work-related fatalities – Occupation, 2022
In 2022, the occupation group ‘Machinery Operators and Drivers’ had the highest share of worker fatalities at 38%. Additionally, this group had the highest fatality rate, standing at 8.4 fatalities per 100,000 workers. This rate significantly surpasses other occupations, all of which reported rates below 3 fatalities per 100,000 workers.
Work-related fatalities By Employer’s Industry, 2022
In 2022, the majority of worker fatalities, totalling 71%, were concentrated within three industries. The Transport, Postal, and Warehousing sector accounted for 34% with 67 fatalities, followed by Agriculture, Forestry, and Fishing at 22% with 44 fatalities, and Construction with 14% and 27 fatalities.
Among these, the Agriculture, Forestry, and Fishing industries had the highest fatality rate, standing at 14.7 fatalities per 100,000 workers, followed by the Transport, Postal, and Warehousing industries with a rate of 9.5 fatalities per 100,000 workers.
Work-related injury and illness
Safe Work Australia gathers comprehensive national workers’ compensation statistics through collaboration with workers’ compensation authorities across states, territories, and the Commonwealth government.
This valuable data is then consolidated into the National Data Set for Compensation-based Statistics (NDS), serving as the cornerstone of Safe Work Australia’s insights into work-related injuries and illnesses.
In the 2021-22 period, data from the Australian Bureau of Statistics Work-related Injuries Survey indicated that 497,300 individuals, constituting 3.5% of the working population, reported experiencing work-related injuries or illnesses. This percentage reflects a decline from 4.2% in 2017-18 and 6.4% in 2005-06. However, it’s important to exercise caution in interpreting these figures for the 2021-22 reference period, as the reduced economic activity during the COVID-19 pandemic may have contributed to a lower likelihood of work-related injuries.
These findings align with data from Safe Work Australia’s National Data Set for Compensation-based Statistics (NDS). Between 2020-21 and 2021-22, while the number of serious claims decreased slightly by 1,400 (or 1.1%), there was a significant increase in COVID-19-related serious claims, rising by 9,100 during the year.
Comparing the current data with a decade ago (2011-12), the number of serious claims has seen a marginal increase of 3,000, or 2.4%. When adjusted for changes in hours worked, the claims frequency rate demonstrated a notable 9.7% reduction, settling at 6.5 in 202021
Note: In this report, the data pertains to serious claims, which are characterized by involving a minimum of one working week of time off work. It’s important to note that the data for 2021-22 is preliminary (indicated by a ‘p’) and may undergo revisions in subsequent years as additional claims are finalized.
In September 2023, Safe Work Australia introduced enhancements to the estimates of the working population used in calculating injury rates derived from the National Dataset for Workers’ Compensation Statistics (NDS). Consequently, there is a noticeable break in series for work-related injury frequency and incidence rates using the NDS data from 2021-22 onwards, indicated by a dotted line. We advise exercising caution when interpreting time series changes in rates calculated from the NDS spanning the period before and after this modification.
ii The ‘claims frequency rate’ is defined as the number of serious claims per million hours worked, utilizing estimates of the working population covered by workers’ compensation schemes.
iii The ‘claims incidence rate’ is defined as the number of serious claims per thousand workers.
It’s worth noting that there are substantial variations in the number of hours worked among different worker groups and at different time intervals. The claims frequency rate takes these variations into account, enabling more accurate comparisons between diverse worker groups and across different time frames.
Work-related injury and illness – Demographics
Serious Claims by Sex, 2021-22p
Men constituted the majority (60.8%) of individuals making serious claims, and they also exhibited a higher claims frequency rate at 7.0 compared to women at 5.7. In simpler terms, when adjusting for variations in work hours, men were 22.8% more likely to file a serious workers’ compensation claim than women.
Moreover, there were notable distinctions in the nature of work-related injuries and diseases experienced by men and women, as evidenced by the compensation amounts and time off associated with serious claims in each gender category.
Claims filed by women resulted in a longer median time off work, with an average of 8.8 weeks, while claims by men averaged 7.6 weeks.
However, claims made by men featured a higher median compensation payout, standing at $16,476, in contrast to women’s claims with a median payout of $14,604. This variance can be attributed to the specific types of injuries and diseases sustained, the occupational fields where men and women are more commonly employed, and differences in remuneration.
Serious Claims by Age group, 202122p
Considering variations in work hours among different worker groups, it’s noteworthy that the serious claims frequency rate was highest among individuals aged 55-64 years in 2021-22p, registering at 8.6 claims per million hours worked. This was followed closely by workers aged 65 and over, with a rate of 7.5.
Conversely, the lowest frequency rate in 2021-22p was observed in workers aged 34-44 years, standing at 5.4 claims per million hours worked, with those aged 25-34 years close behind at 5.6.
Younger workers under the age of 25 exhibited a slightly elevated likelihood, with a rate of 6.8 claims per million hours worked, compared to the overall average.
Work-related injury and illness – Claims by Mechanism
Serious Claims by Most Common Mechanism, 2021-22p
Serious Claims by Mechanism and Sex, 2021-22p
Gender disparities are evident in the realm of serious workers’ compensation claims. Men tend to surpass women by more than double in claims related to Being hit by moving objects, Vehicle incidents, and other incidents, as well as Hitting objects with a part of the body, with three times as many claims.
On the other hand, women outpace men in serious claims related to Mental stress, with a rate exceeding twice that of men (12.5% compared to 6.0%).
Work-related injury and illness – Claims by Nature
Serious Claims by Nature, 2021-22p
Over the past decade, there has been a notable rise in the proportion of serious claims attributed to diseases and conditions, which has increased from 26.0% to 34.0%.
Work-related injury and illness – Mental health serious claims
In 2021-22p, mental health conditions constituted 9.2% of serious claims, totalling 11,700 cases. Although this represents a slight decrease from the previous year, it is significantly higher than the figures recorded a decade ago.
Over the decade leading up to 2021-22p, there has been a notable increase in the proportion of claims related to mental health conditions, rising from 6.5% in 2011-12 to 9.2% in 2021-22p. This growth has been driven by a substantial annual increase of 3,500 claims, representing a 43.3% rise over the period. Notably, this category has seen the largest annual claim increase among all nature of injury/illness major groups.
Workplace mental health conditions incur significant costs, including extended periods of time off work and higher compensation payouts compared to physical injuries and diseases. In 2020-21, the median time lost due to mental health condition claims (34.2 working weeks) was more than four times the median time lost across all claims (8.0 weeks). Similarly, the median compensation paid for mental health condition claims in 2020-21 ($58,615) was nearly four times higher than the median compensation paid across all claims ($15,743).
COVID-19 Serious Claims by Industry, 2021-22p
In 2021-22, which is the period of reference for this data, significant COVID-19 outbreak events took place, including the ‘Delta’ and ‘Omicron’ waves. Consequently, there is a notable increase in COVID-19 serious claims when compared to the preceding year, with an increase of over 9,100 claims.
It’s important to approach this data with caution. Some jurisdictions introduced presumptive rights for employees in specific occupations who contracted COVID-19. The covered occupations varied among jurisdictions.
Serious workers’ compensation claims related to COVID-19 constituted 7.5% of the total number of serious claims in the 2021-22p fiscal year. Within this period, the Public administration and safety industry reported the highest proportion of COVID-19 serious claims at 25.6%, followed by healthcare and social assistance (20.7%), and Education and training (13.8%).
Work-related injury and illness – Claims by Bodily location
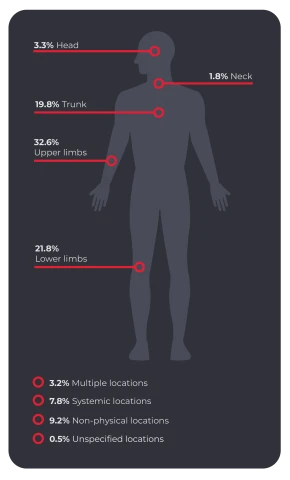
Serious Claims by Bodily location, 2021-22p
Work-related injury and illness – Claims by Occupation
Serious Claims by Occupation, 2021-22p
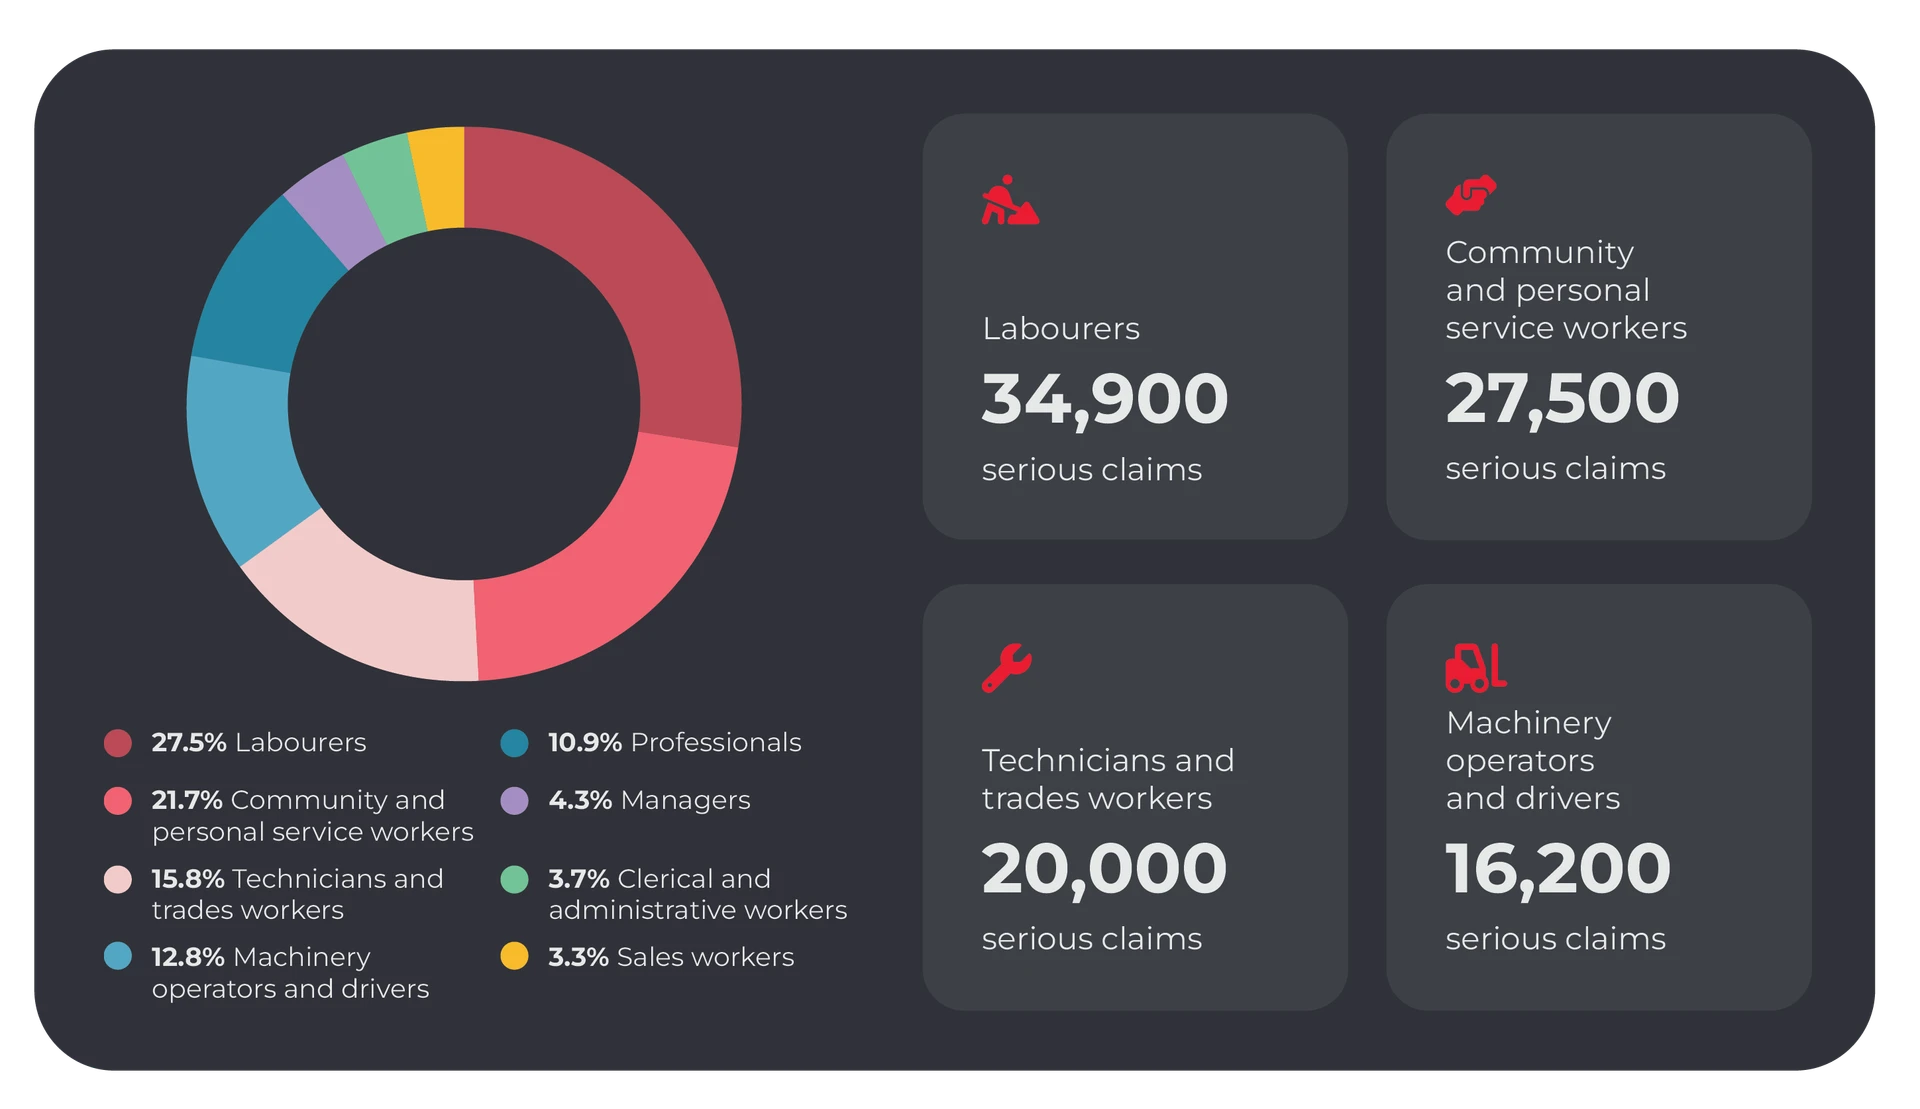
In terms of the Serious claims frequency rate, it was notably higher for individuals employed as Labourers (24.8 claims per million hours worked), followed by Community and personal service workers (15.6), Machinery operators and drivers (11.5), and Technicians and trades workers (7.4). In contrast, the remaining four occupational groups all reported significantly lower frequency rates, each with less than four serious claims per million hours worked.
When considering the sheer volume of serious claims in 2021-22p, the top-ranking occupations were Labourers (34,900 claims), Community and personal service workers (27,500), Technicians and trades workers (20,000), and Machinery operators and drivers (16,200).
These four occupational groups collectively accounted for an impressive 77.7% of all serious claims in 202122p, despite representing only 38.2% of the total workforce.
Work-related injury and illness – Claims by Industry
Serious Claims by Industry, 2021-22p
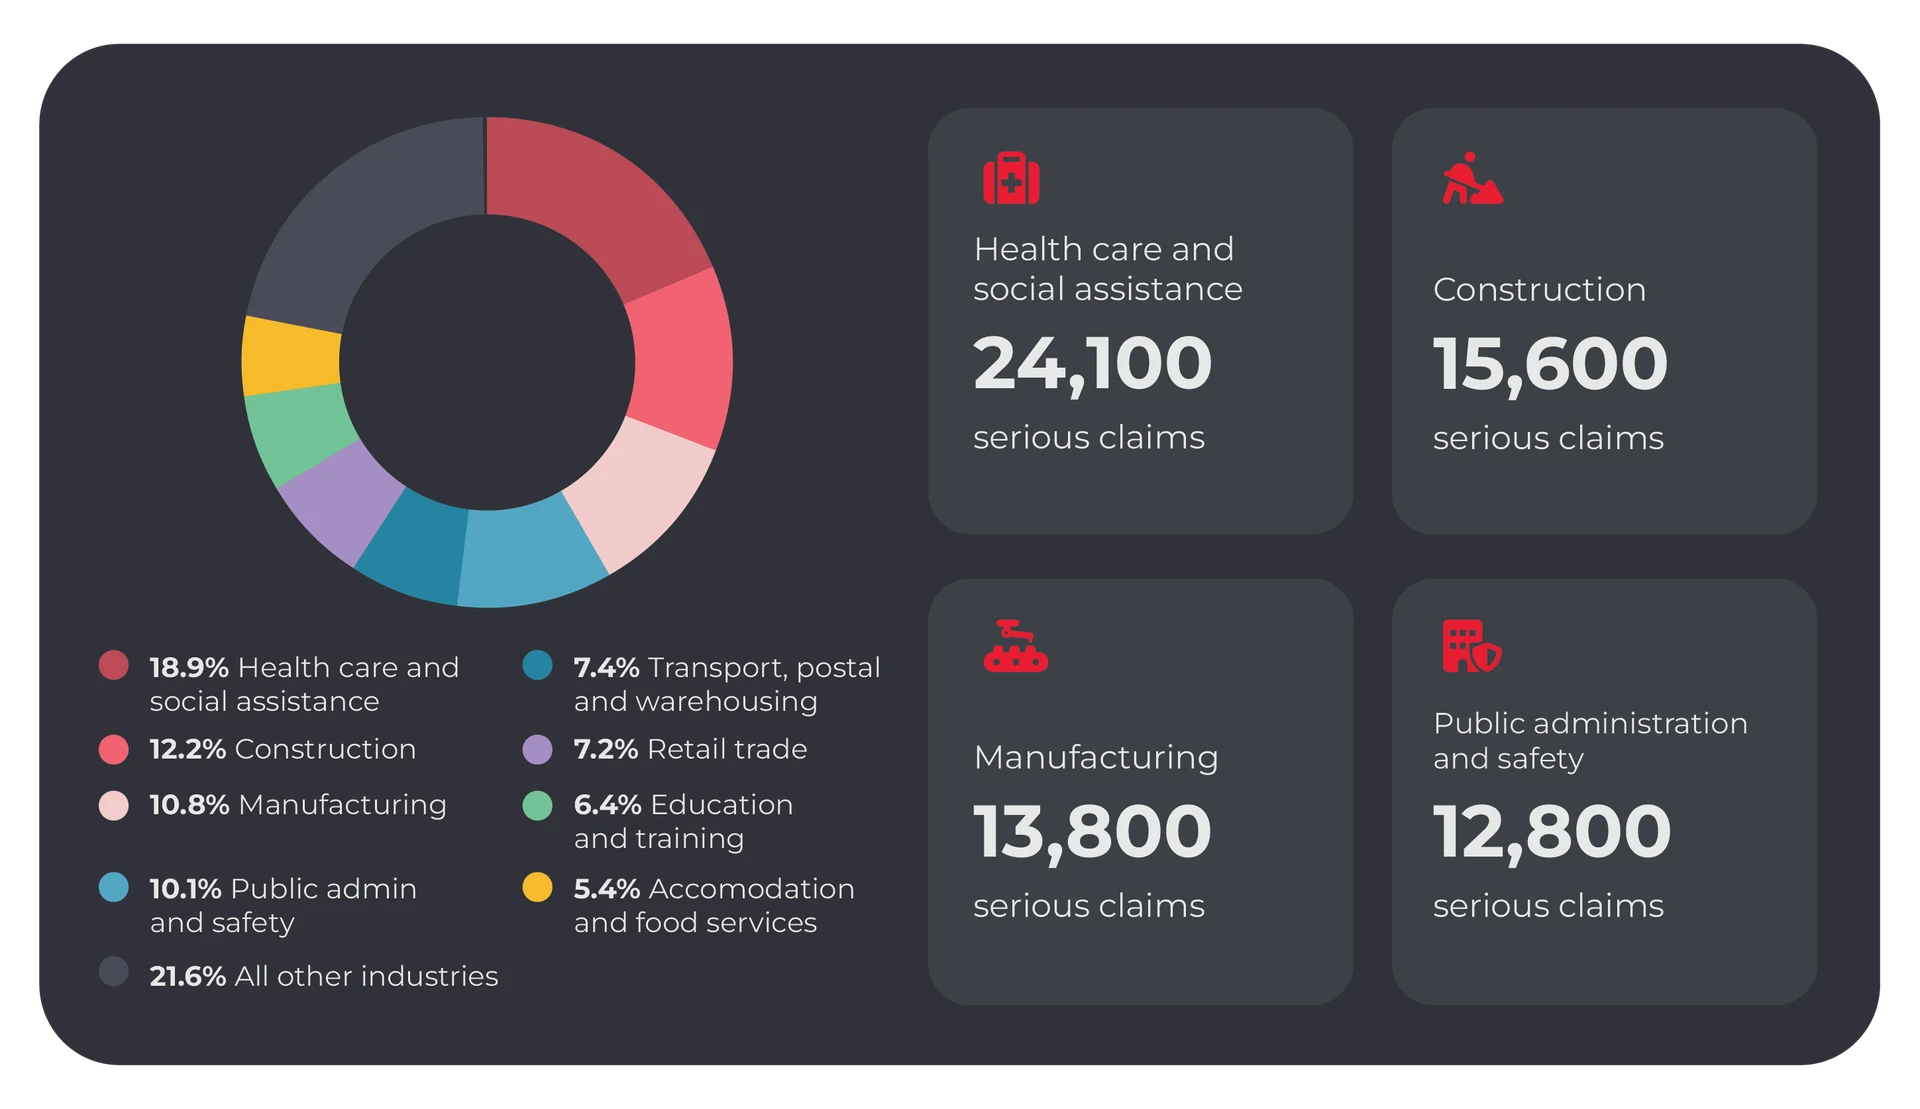
In terms of the Serious claims frequency rate, it was notably higher for individuals employed in the Agriculture, forestry and fishing industry (10.9 serious claims per million hours worked), followed closely by the Construction industry (9.8), and Public administration and safety (9.8).
Remarkably, these three industries collectively contributed to 25.3% of all serious claims in 2021-22p, despite comprising just 14.6% of the total workforce.
The leading industries in terms of serious claims for 2021-22p were Health care and social assistance (24,100), Construction (15,600), Manufacturing (13,800), Public administration and safety (12,800), and Transport, postal and warehousing (9,500).


Recent Comments